DIBELS 8 data meetings without the spreadsheet spiral
The benchmark window closes Friday. Your data meeting is Monday at 7:30am. That weekend in between is where most of the value of DIBELS gets lost.
The benchmark window closes on a Friday. Your data meeting is Monday morning at 7:30. The weekend in between is where most of the value of DIBELS gets lost.
You log into mClass. You export the class report. You stare at twenty-something rows of scores across LNF, PSF, NWF, WRF, and ORF — some red, some yellow, some green. You know which kids are at risk. You don't yet know how to group them, what to actually do with each group on Monday, or what to tell parents who are going to ask. By the time you've cobbled it together — half in a spreadsheet, half in a notebook, half from memory — it's Sunday at 9pm and the plan you bring to the meeting is whatever you had energy left to make.
The data tells you what to worry about. It doesn't tell you what to do. The gap between those two is where good intentions go to die.
The bottleneck nobody warns you about
DIBELS 8 is good at one specific thing: telling you, in about ten minutes per kid, which slice of foundational reading skill is weakest. That diagnostic is genuinely useful. The problem is what happens next.
The data meeting after a benchmark window is supposed to produce three things: a set of intervention groups, a clear next move for each group, and a documented plan. Most data meetings produce one of the three, on a good day. The other two get punted to "we'll figure it out this week," which usually means the same instructional moves as last benchmark window, plus a little stress.
This isn't a teacher problem. It's a tooling problem. The mClass export is a CSV. The grouping logic is in your head. The intervention library is on a Pinterest board, in a Google Doc somewhere, and in three TPT downloads you can't quite find. The parent letter is whatever you write at 10pm. Each of those is a separate task running on a separate tool, and the cost of moving between them is what kills the meeting prep.
What the meeting should look like
A useful data meeting — the kind that ends with a plan you can actually run on Monday — has a specific shape. It's not long. It's not complicated. It just needs the right inputs lined up.
Inputs: Current benchmark scores, last benchmark's scores (for trajectory), and a rough picture of who's been getting which intervention so far.
Conversation: Twenty minutes of triage. Who's well below benchmark and needs urgent attention. Who's strategic and should be grouped together. Who's at benchmark and just needs the regular literacy block. Who's surprising you — a kid you thought was solid who slipped, or the opposite.
Outputs: A small number of groups (usually 3-5), a defined skill focus for each group, a starting routine for each group (whether it's a tomorrow-move or a four-week plan), and a printable artifact that lives in your data binder, the principal's data binder, and goes home to parents in some form.
The meeting itself should take maybe 25-30 minutes. The prep, ideally, should take 10. In most schools, it's the inverse — the prep takes hours, the meeting is rushed, and the artifact is a printout of the scores with some sticky notes on it.
What a tool for this should do
The right tool for data-meeting prep should do four specific things, in order:
1. Take a paste of scores and turn them into bands. Not just red/yellow/green — though those should be there for the principal's binder — but also a teacher-friendly version: "intensive," "strategic," "benchmark," "above benchmark." Same kids, two views, depending on who's reading.
2. Suggest groupings. Kids cluster by skill, not by overall score. A kindergartner who's low on PSF needs a different intervention from a kindergartner who's low on NWF, even if they have the same composite. A good grouping view shows you who shares a skill gap, not just who shares a score range.
3. Give you a tomorrow-move per group. Not a full intervention plan — that takes more time than you have. Just: "Phonemic awareness group: 5-minute oral segmentation routine, three days this week." Enough to walk out of the meeting with a Monday morning plan.
4. Print a meeting-ready artifact. One page per group, plus a class-overview page, plus a parent letter draft per kid (or per group). Something you can actually hand to the team, drop in the binder, and send home.
None of that is rocket science. It's just plumbing. But the plumbing is what determines whether the data meeting produces a plan or a vague vibe.
Where the existing options break
You can do all of this manually. Teachers do it every benchmark window. But the manual version takes 2-3 hours per teacher per benchmark, three times a year. That's a full school day per teacher per year, spent in a spreadsheet.
The big assessment platforms (mClass, NWEA, etc.) have some grouping and reporting features built in, but they're usually designed for principals or coaches, not for the teacher prepping a data meeting at 9pm on Sunday. They're also locked inside the platform — you can't take them home, you can't customize them, and they don't connect to the actual intervention you'd run.
The freebies on TPT are mostly tracker templates — a spreadsheet to type your scores into. Useful, but they stop where the work actually starts: at "now what do I do with these?"
The intervention curricula are good at the intervention but rarely connected to the data. You buy a phonics program. It tells you how to teach phonics. It doesn't tell you which of your specific kids need it most this week.
The gap is in the middle: data on one side, intervention on the other, no bridge.
What we built
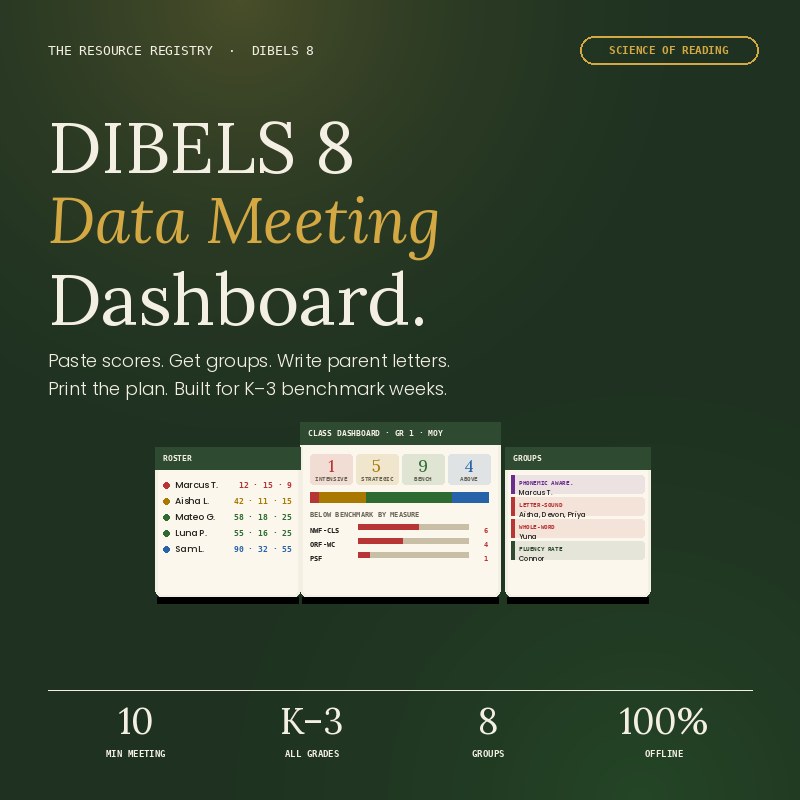
We made the DIBELS 8 Data Meeting Dashboard to be that bridge. It's an offline HTML tool plus a Google Sheets companion. You paste your DIBELS 8 scores, and it produces:
- Color-coded bands per student, in both simplified labels (intensive / strategic / benchmark / above) and the official R / Y / G / B framework
- Suggested small groups organized by skill gap, not just by composite score
- A tomorrow-move per group — a starting routine you can run on Monday with materials you already have
- A printable meeting artifact: class overview, per-group page, and per-student parent letter draft
The whole flow is designed to fit in the 10-minute window between "I have the scores" and "I have the plan." It runs offline (no login, no internet) so you can prep on the train, in the parking lot, wherever. The Google Sheets companion is for the people on your team who prefer that format.
It's built for K-3 because that's where DIBELS 8 is most predictive and where the intervention decisions matter most. We're adding G4-8 support in a v2.0 update later this year.
If you've already got the existing DIBELS 8 practice packs, the dashboard is the thing that tells you which kid in which group needs which pack. That's the whole stack: data → groups → intervention → tracker, with each piece doing the job it's good at.
The honest version
This is the most teacher-leverage tool I've built. Not because it's clever — it's not. It's just plumbing. But it's plumbing that turns a 3-hour meeting prep into a 10-minute one, three times a year. That's a school day back per teacher, every year. The math on that is obvious.
The catch: it only works if your DIBELS data is clean and current. Garbage in, garbage out — there's no machine learning in here pretending the data is better than it is. If you're skipping benchmark windows or running them inconsistently, the dashboard will reflect that.
If your data IS clean — and it usually is, because mClass is pretty good at this — the dashboard will tell you, in about ten minutes, what your data meeting should be about. Then you can spend the meeting actually meeting, instead of figuring out what to talk about in the first place.
The DIBELS 8 Data Meeting Dashboard is independent content from The Resource Registry. It is not affiliated with or endorsed by DIBELS, the University of Oregon, Amplify, or Acadience Learning. All content, intervention suggestions, and parent letter templates are original.